Introduction
In the realm of business intelligence and data analytics, Power BI has established itself as a prominent tool for visualizing and exploring data. Properly organizing the data model is crucial for efficient analysis and reporting, particularly when dealing with extensive datasets. One widely adopted approach for structuring data in Power BI is the star schema. In this article, we will delve into the concept of a star schema and offer practical recommendations on organizing it effectively in Power BI.
Understanding the Star Schema
The star schema represents a dimensional data model frequently utilized in data warehousing and business intelligence. It comprises a central fact table surrounded by dimension tables. The fact table holds measurable data (e.g., sales, revenue), while the dimension tables provide contextual information and descriptive attributes for the data (e.g., date, product, customer). This structure enables optimized querying and aggregation of data.
Step 1: Identifying the Fact Table
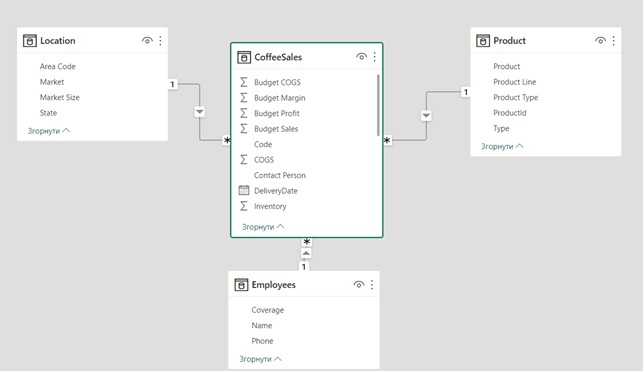
To begin organizing a star schema, the first step involves identifying the fact table, which encompasses the core data you intend to analyze. It should contain numeric or additive measures that allow for aggregation, such as sales amounts or quantities. In our example, it can be CoffeeSales table which contains all product sales with each row representing a single transaction.
Step 2: Creating Dimension Tables
Next, proceed with creating dimension tables that provide context to the measures in the fact table. Dimension tables should encompass descriptive attributes related to the data in the fact table. For instance, if you analyze sales data, dimension tables may consist of tables for date, product, customer, and location. Notice that dimension tables usually have few rows and each row is unique – you may have many sales of Kona coffee in Fact Table but only one row for Kona coffee in Dimension table. In our case, we have three Dimension Tables – Location, Product and Employees each one fully and uniquely identifying one dimension of the data.
Step 3: Establishing Relationships
Establishing relationships between the fact table and dimension tables is vital for creating meaningful visualizations and conducting analysis. Power BI offers various methods for defining relationships, including automatic detection and manual setup. To define relationships, select the relevant columns in the fact table and dimension tables, and specify the relationship type (e.g., one-to-many, many-to-one). Remember, that Fact Table would always be “many” side represented by a star * and Dimension Table will always be “one” side represented by 1. Observe that we put our Fact Table CoffeeSales in the middle of data model with arrows pointing to Dimension Tables.
Conclusion
Efficiently organizing a star schema in Power BI is imperative for facilitating seamless data analysis and reporting. By following the steps outlined in this guide, you can establish a well-structured data model that empowers you to explore your data with ease.